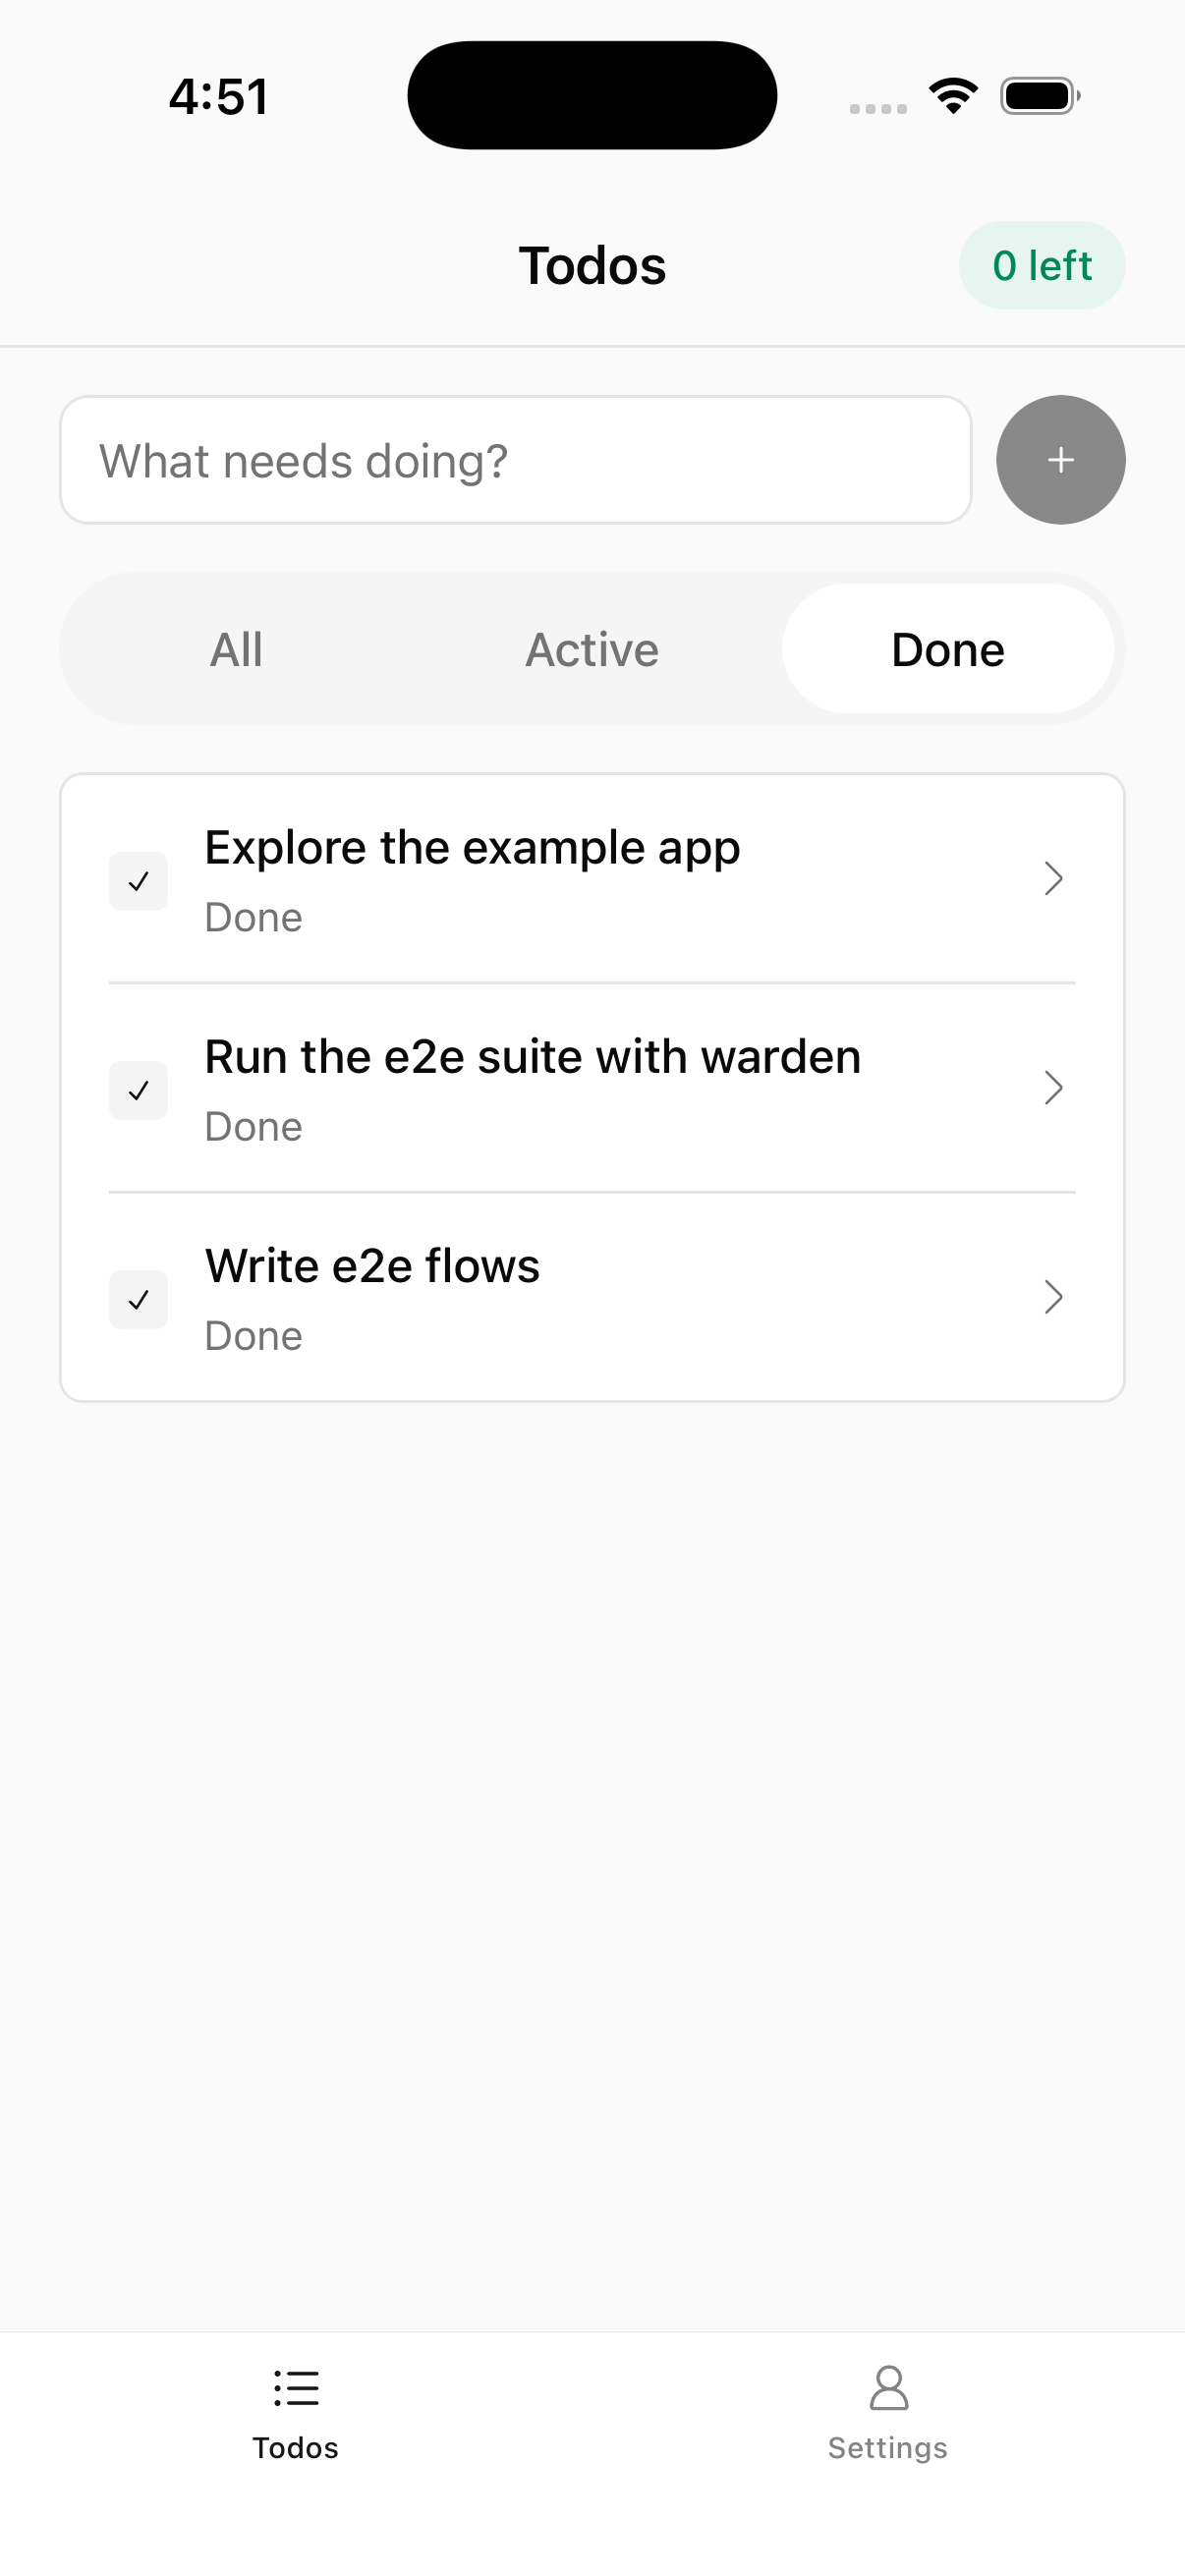
iOS run 2026-10-25 on EAS
The four-framework iOS run of 2026-10-25 at warden 0.3.1, one EAS macos-large worker per framework, 5 runs each, with how it was run, the full tables and every artifact.
The run behind the 2026-10-25 iOS dataset on the comparison page. Everything below comes from the four workers' artifacts, merged into one report; nothing was measured on a developer machine.
Headline
warden ran the warm 8-test suite in 86.30 s. That is 1.56× faster than Argent (134.32 s), 1.06× faster than agent-device (91.61 s, one failed test) and 1.54× faster than tester.army (132.52 s). Per step, warden's median is 85 ms against 321 ms (Argent, 3.8×), 471 ms (agent-device, 5.5×) and 481 ms (tester.army, 5.7×). Its host CPU is 2.97 CPU-s per rep against 4.13 (Argent, 1.4×), 11.18 (agent-device, 3.8×) and 17.74 (tester.army, 6.0×).
How it was run
| Workflow | apps/example/.eas/workflows/bench-baseline.yml, EAS Workflows run 01a1756a-abaa-7940-95ba-336e7d9160e9, inputs runs=5, frameworks=warden,argent,agent-device,tester-army, max_minutes=55 |
| Code | warden commit 51bb4cee (branch develop, warden 0.3.1), every suite under packages/e2e-bench/suites/ |
| Workers | One EAS macos-large worker per framework, four in all. VM template macos-tahoe-26.5-xcode-26.6: VirtualMac2,1, Apple M4 Pro (Virtual), 10 cores, 40 GB, macOS 26.5.2 (25F84), Xcode 26.6 (17F113) |
| Simulator | Each worker claims its own headless simulator with warden claim ios --headless (iPhone 17, iOS 26.5, named warden-iphone-17-1), created fresh for the job and shut down at the end. Nothing one framework leaves behind can reach another |
| App | The same build on every worker: nz.co.delacour.warden.example, EAS bench profile (Release, simulator), sha256 c283eae41c7a, 101.1 MB, reused by fingerprint (build_ios skipped), installed with simctl install before the bench |
| Runs | 5 runs of the 8-test suite per framework. Run 1 is cold; warm numbers are the median of runs 2 to 5. retries=0, fresh app launch per test, caffeinate -dims held |
| Before the bench | bun install, warden-simd built from source (Swift release), the framework installed (bun add -g @swmansion/argent@0.30.1 / agent-device@0.21.31; tester.army's e2e 0.20.0 comes with bun install, Node 22.23.1), then the job waits for the 1-minute load average to drop under the core count and records a 60 s idle control of the simulator with the app in the foreground |
| Deep-link sheet | iOS shows "Open in …?" for the first custom-scheme link after a boot and never again, so the harness opens one link and answers the sheet before every framework's prepare. No suite handles the sheet itself |
| Hard stop | A watchdog stops the bench at max_minutes; it did not fire on any worker (the longest job, agent-device, ran 28 min) |
| Isolation per framework | Helpers of every framework stopped, driver apps uninstalled before the run (cold cost measured), residue listed after teardown |
| Sampling | Host and simulator processes sampled every 500 ms from ps; the CPU headline is CPU-seconds of the framework's own process tree during the timed run, warm median |
| Evidence on exit | Each job screenshots the simulator and lists the apps still running, releases the lease even when a step failed, and uploads an eas-ios-<framework> artifact |
| Versions | bun 1.3.14, warden 0.3.1, Argent 0.30.1, agent-device 0.21.31, tester.army e2e 0.20.0 (bundled agent-device 0.21.25), Node 22.23.1 |
Hosted workers idle hotter than a Mac and share their host, so these numbers compare only with other macos-large runs, never with runs on other hardware.
agent-device dropped one test in run 1 (sign-in/field-errors: its fill read back an empty field after typing), so its pass rate is 97.5% and, by the fairness rules, it cannot be called fastest even where a per-test median is lower. Its other 39 tests passed.
Results
Summary
| Framework | Status | Version | Suite median (warm) | p95 | Ratio | Cold rep 1 | Cold-start cost | Prepare | Teardown | Overhead | Pass rate | Flake | Residue | Footprint (LOC / deps) |
|---|---|---|---|---|---|---|---|---|---|---|---|---|---|---|
| warden | ok | bun 1.3.14 + warden-e2e | 86.30 s | 86.71 s | 1.00× | 71.98 s | none (rep 1 not slower, -13.72 s) | 596 ms | 72 ms | 67 ms | 100% | 0% | 0 proc / 0 app / 0 path | 379 LOC / 0 B |
| argent | ok | 0.30.1 | 134.32 s | 134.65 s | 1.56× | 133.61 s | 1.01 s | 1.72 s | 293 ms | 163 ms | 100% | 0% | 0 proc / 0 app / 1 path | 161 LOC / 0 B |
| agent-device | ok | agent-device 0.21.31 | 91.61 s ✗ | 91.70 s | 1.06× | 87.46 s | 12.23 s | 16.37 s | 315 ms | 213 ms | 97.5% | 2.5% | 0 proc / 1 app / 1 path | 158 LOC / 0 B |
| tester-army | ok | e2e 0.20.0 | 132.52 s | 132.89 s | 1.54× | 150.63 s | 18.11 s | 0 ms | 495 ms | 2.24 s | 100% | 0% | 0 proc / 1 app / 1 path | 307 LOC / 0 B |
Per-test medians (ms)
| Test | warden | argent | agent-device | tester-army |
|---|---|---|---|---|
| onboarding steps through to sign-in | 2929 (1.00×) | 8301 (2.83×) | 3830 (1.31×) | 5964 (2.04×) |
| invalid email and short password show field errors | 16054 (1.00×) | 18221 (1.13×) | 16579 ✗ (1.03×) | 21119 (1.32×) |
| a locked account shows the form alert | 10096 (1.04×) | 14442 (1.49×) | 9673 (1.00×) | 12914 (1.34×) |
| valid credentials land on todos | 9788 (1.00×) | 15416 (1.58×) | 9784 (1.00×) | 14850 (1.52×) |
| add, complete and filter todos | 14494 (1.00×) | 21110 (1.46×) | 15470 (1.07×) | 21230 (1.46×) |
| open a todo, mark it done, then delete it | 11089 (1.00×) | 19105 (1.72×) | 12422 (1.12×) | 18121 (1.63×) |
| deep link opens a todo by id | 10656 (1.02×) | 17811 (1.70×) | 10483 (1.00×) | 18094 (1.73×) |
| settings shows the account, toggles switches and signs out | 10945 (1.00×) | 19616 (1.79×) | 13136 (1.20×) | 18075 (1.65×) |
Per-step latency
| Framework | Steps | Median | p95 | Max |
|---|---|---|---|---|
| warden | 504 | 85 ms | 3.63 s | 4.98 s |
| argent | 1192 | 321 ms | 1.82 s | 2.82 s |
| agent-device | 632 | 471 ms | 1.62 s | 1.89 s |
| tester-army | 592 | 481 ms | 3.21 s | 4.01 s |
Where step time goes
Step scopes differ per tool: warden's one fill step spans the focus tap, select-all, typing and read-back confirm, argent reports a separate idle step and into …, agent-device reports fill and type separately, and tester.army reports locator steps. Compare a verb's share within a tool, not its median across tools.
warden
| Verb | n | Share | Median | p95 | Max |
|---|---|---|---|---|---|
| fill | 68 | 80.4% | 3.38 s | 4.20 s | 4.98 s |
| tap | 180 | 10.6% | 75 ms | 333 ms | 620 ms |
| expect | 256 | 9.1% | 21 ms | 558 ms | 578 ms |
argent
| Verb | n | Share | Median | p95 | Max |
|---|---|---|---|---|---|
| into | 68 | 27.9% | 2.15 s | 2.81 s | 2.82 s |
| idle | 232 | 27.5% | 925 ms | 1.04 s | 1.24 s |
| visible | 320 | 18.3% | 13 ms | 1.03 s | 1.04 s |
| id= | 380 | 12.8% | 322 ms | 352 ms | 372 ms |
| launch | 32 | 10.9% | 1.80 s | 1.82 s | 1.83 s |
| hidden | 32 | 2.4% | 16 ms | 1.05 s | 1.05 s |
| open-url | 4 | 0.1% | 116 ms | 124 ms | 124 ms |
| next-test.yaml | 28 | 0% | 4 ms | 6 ms | 6 ms |
| other | 96 | 0% | 1 ms | 5 ms | 6 ms |
agent-device
| Verb | n | Share | Median | p95 | Max |
|---|---|---|---|---|---|
| press | 244 | 40.6% | 520 ms | 1.02 s | 1.09 s |
| type | 64 | 23.9% | 1.26 s | 1.86 s | 1.89 s |
| wait | 276 | 20.9% | 55 ms | 969 ms | 1.08 s |
| open | 36 | 9% | 1.02 s | 1.07 s | 1.10 s |
| fill | 12 | 5.5% | 1.69 s | 1.75 s | 1.75 s |
tester-army
| Verb | n | Share | Median | p95 | Max |
|---|---|---|---|---|---|
| getbytestid | 496 | 69.5% | 267 ms | 3.23 s | 4.01 s |
| dismiss | 52 | 22.3% | 2.26 s | 2.33 s | 2.33 s |
| (unlabelled) | 32 | 6.3% | 1.03 s | 1.05 s | 1.06 s |
| accept | 4 | 1.6% | 2.02 s | 2.03 s | 2.03 s |
| warden-example | 4 | 0.2% | 290 ms | 295 ms | 295 ms |
| getbytext | 4 | 0.1% | 65 ms | 66 ms | 66 ms |
Untraced time
| Framework | Untraced / rep | Share of test time | Largest (test) |
|---|---|---|---|
| warden | 3.17 s | 3.7% | todo-detail/deep-link (716 ms) |
Test wall time that no step and no span of the framework's own trace covers (warden: trace.jsonl; nested steps and spans count once). Runner overhead, hooks, sleeps and calls nobody wrapped end up here.
Resources
| Framework | Scope | CPU-s / rep | CPU-s (whole) | CPU avg | CPU peak | RSS avg | RSS peak |
|---|---|---|---|---|---|---|---|
| warden | host | 2.97 s | 15.36 s | 3.0% | 38.8% | 145.9 MB | 158.6 MB |
| warden | sim | — | 329.55 s | 74.3% | 282.8% | 10.6 GB | 10.7 GB |
| argent | host | 4.13 s | 21.38 s | 2.7% | 41.8% | 181.4 MB | 236.7 MB |
| argent | sim | — | 325.71 s | 44.5% | 209.9% | 10.5 GB | 10.6 GB |
| agent-device | host | 11.18 s | 78.73 s | 13.6% | 611.5% | 711.9 MB | 2.4 GB |
| agent-device | sim | — | 433.50 s | 86.0% | 248.7% | 10.8 GB | 11.0 GB |
| tester-army | host | 17.74 s | 110.24 s | 13.8% | 611.2% | 598.2 MB | 2.5 GB |
| tester-army | sim | — | 619.50 s | 84.1% | 248.1% | 11.1 GB | 11.4 GB |
Sampled every 500 ms from ps. host = the framework's own process tree; sim = every process of the simulator's launchd_sim tree, or on Android the app under test plus every framework's on-device helpers from top (every 2 s). RSS is a per-process sum, so shared framework pages are counted once per process: compare the numbers across frameworks, not against physical memory.
CPU-s / rep (the CPU headline) is the CPU time of the timed run only, median over the warm reps (over every rep, cold included, when a framework has no warm rep, as with --runs 1), from per-process deltas of ps time; the other columns are whole-framework (prepare, every rep, the per-rep housekeeping and teardown), so their averages move with suite length. CPU avg / CPU peak are ps %cpu, a decaying average on macOS, kept for comparison with older runs. Android sim has no CPU-seconds (top only). CPU-seconds undercount: CPU a process uses after the last 500 ms tick, and processes living between ticks, are only recovered for children the bench ran itself (their rusage at exit); daemons and processes a framework spawns and never waits for are not, so frameworks that fan out to many short-lived tools read low. An exit charge is booked to its root's group, so in the per-group split the unseen CPU of a descendant of another group (a bun test under a warden root) shows under the root. procps (Linux) ps time has 1 s resolution.
Host by process group
| Framework | Group | CPU-s (whole) | RSS avg | RSS peak |
|---|---|---|---|---|
| warden | bun-test | 6.21 s | 89.6 MB | 102.2 MB |
| warden | warden-simd | 8.61 s | 56.2 MB | 56.7 MB |
| warden | warden-cli | 0.11 s | 131.6 KB | 78.8 MB |
| warden | other | 0.43 s | 0 B | 0 B |
| argent | other | 21.38 s | 181.4 MB | 236.7 MB |
| agent-device | other | 78.73 s | 711.9 MB | 2.4 GB |
| tester-army | other | 110.24 s | 598.2 MB | 2.5 GB |
bun-test the spec process, warden-simd the resident iOS helper, warden-cli the warden commands the bench spawned, adb / emulator the Android tools, other the rest (another framework's runner, xcrun, java). Each group's RSS average counts 0 for ticks without a process, so the groups add up to the host.
Where the CPU goes
warden
| Process | Scope | CPU-s | Share | RSS avg | RSS peak | Spawns |
|---|---|---|---|---|---|---|
| warden-simd | host | 1.76 s | 60.0% | 56.5 MB | 56.7 MB | 1 |
| bun test | host | 1.16 s | 39.5% | 90.1 MB | 101.3 MB | 1 |
| bun test (exit charge) | host | 0.01 s | 0.5% | 0 B | 0 B | 0 |
| bun cli.ts | host | 0.00 s | 0.0% | 0 B | 0 B | 0 |
| simctl | host | 0.00 s | 0.0% | 0 B | 0 B | 0 |
| wardenexample | sim | 32.07 s | 48.8% | 373.1 MB | 428.9 MB | 8 |
| iOS | sim | 25.41 s | 38.6% | 9.7 GB | 9.7 GB | 108 |
| SimulatorFrameworkBridge-iOS serve | sim | 3.53 s | 5.4% | 185.6 MB | 199.8 MB | 13 |
| bun cli.ts | sim | 2.28 s | 3.5% | 228.3 MB | 229.5 MB | 1 |
| CoreSimulatorBridge | sim | 1.25 s | 1.9% | 84.9 MB | 85.0 MB | 1 |
| ps | sim | 0.69 s | 1.0% | 1.8 MB | 1.8 MB | 171 |
| launchd_sim | sim | 0.33 s | 0.5% | 36.8 MB | 36.8 MB | 1 |
| xpcproxy_sim | sim | 0.22 s | 0.3% | 411.4 KB | 13.3 MB | 7 |
| pkd | sim | 0.00 s | 0.0% | 58.9 MB | 58.9 MB | 1 |
| aslmanager | sim | 0.00 s | 0.0% | 21.2 MB | 21.2 MB | 1 |
| caffeinate | sim | 0.00 s | 0.0% | 7.3 MB | 7.3 MB | 1 |
| (launchctl) | sim | 0.00 s | 0.0% | 0 B | 0 B | 0 |
| other | sim | 0.00 s | 0.0% | 0 B | 0 B | 0 |
argent
| Process | Scope | CPU-s | Share | RSS avg | RSS peak | Spawns |
|---|---|---|---|---|---|---|
| simulator-server | host | 3.92 s | 95.6% | 96.0 MB | 96.0 MB | 1 |
| node argent | host | 0.18 s | 4.3% | 85.7 MB | 88.1 MB | 1 |
| node argent (exit charge) | host | 0.00 s | 0.1% | 0 B | 0 B | 0 |
| (simctl) | host | 0.00 s | 0.0% | 0 B | 0 B | 0 |
| node tool-server.cjs | host | 0.00 s | 0.0% | 0 B | 0 B | 0 |
| simctl | host | 0.00 s | 0.0% | 0 B | 0 B | 0 |
| system_profiler | host | 0.00 s | 0.0% | 0 B | 0 B | 0 |
| wardenexample | sim | 33.67 s | 52.9% | 374.7 MB | 434.8 MB | 8 |
| iOS | sim | 24.31 s | 38.2% | 9.7 GB | 9.7 GB | 106 |
| bun cli.ts | sim | 3.34 s | 5.2% | 225.2 MB | 229.3 MB | 1 |
| ps | sim | 1.07 s | 1.7% | 1.8 MB | 1.8 MB | 267 |
| CoreSimulatorBridge | sim | 0.48 s | 0.8% | 117.8 MB | 118.2 MB | 1 |
| simctl | sim | 0.41 s | 0.6% | 351.9 KB | 20.5 MB | 5 |
| launchd_sim | sim | 0.21 s | 0.3% | 36.9 MB | 36.9 MB | 1 |
| xpcproxy_sim | sim | 0.15 s | 0.2% | 155.7 KB | 12.1 MB | 4 |
| (wardenexample) | sim | 0.04 s | 0.1% | 1.5 MB | 395.3 MB | 1 |
| pkd | sim | 0.00 s | 0.0% | 59.0 MB | 59.0 MB | 1 |
| aslmanager | sim | 0.00 s | 0.0% | 21.1 MB | 21.1 MB | 1 |
| caffeinate | sim | 0.00 s | 0.0% | 7.2 MB | 7.2 MB | 1 |
| other | sim | 0.00 s | 0.0% | 0 B | 0 B | 0 |
agent-device
| Process | Scope | CPU-s | Share | RSS avg | RSS peak | Spawns |
|---|---|---|---|---|---|---|
| xcodebuild | host | 7.97 s | 71.9% | 219.6 MB | 220.4 MB | 1 |
| bun cli.ts | host | 1.93 s | 17.4% | 239.8 MB | 245.3 MB | 1 |
| snapshot-bridge | host | 0.78 s | 7.0% | 116.6 MB | 116.7 MB | 1 |
| ps | host | 0.22 s | 2.0% | 1.8 MB | 1.9 MB | 181 |
| node agent-device | host | 0.14 s | 1.3% | 61.1 MB | 66.7 MB | 1 |
| simctl | host | 0.04 s | 0.4% | 20.3 MB | 20.3 MB | 1 |
| node agent-device (exit charge) | host | 0.01 s | 0.1% | 0 B | 0 B | 0 |
| DTServiceHub | host | 0.00 s | 0.0% | 16.4 MB | 16.4 MB | 1 |
| caffeinate | host | 0.00 s | 0.0% | 7.1 MB | 7.1 MB | 1 |
| (clang) | host | 0.00 s | 0.0% | 0 B | 0 B | 0 |
| (ps) | host | 0.00 s | 0.0% | 0 B | 0 B | 0 |
| (simctl) | host | 0.00 s | 0.0% | 0 B | 0 B | 0 |
| other | host | 0.00 s | 0.0% | 0 B | 0 B | 0 |
| iOS | sim | 37.64 s | 44.2% | 10.1 GB | 10.1 GB | 110 |
| wardenexample | sim | 36.00 s | 42.3% | 375.2 MB | 438.6 MB | 8 |
| AgentDeviceRunnerUITests-Runner | sim | 10.00 s | 11.7% | 269.7 MB | 269.8 MB | 1 |
| simctl | sim | 0.55 s | 0.6% | 749.3 KB | 20.7 MB | 8 |
| CoreSimulatorBridge | sim | 0.54 s | 0.6% | 81.6 MB | 81.7 MB | 1 |
| launchd_sim | sim | 0.21 s | 0.2% | 37.0 MB | 37.1 MB | 1 |
| xpcproxy_sim | sim | 0.16 s | 0.2% | 257.5 KB | 12.7 MB | 6 |
| launchctl | sim | 0.08 s | 0.1% | 24.8 KB | 4.4 MB | 1 |
| pkd | sim | 0.00 s | 0.0% | 59.1 MB | 59.1 MB | 1 |
| aslmanager | sim | 0.00 s | 0.0% | 21.2 MB | 21.2 MB | 1 |
| (launchctl) | sim | 0.00 s | 0.0% | 0 B | 0 B | 0 |
| (managedappdistri) | sim | 0.00 s | 0.0% | 0 B | 0 B | 0 |
| other | sim | 0.00 s | 0.0% | 0 B | 0 B | 0 |
tester-army
| Process | Scope | CPU-s | Share | RSS avg | RSS peak | Spawns |
|---|---|---|---|---|---|---|
| xcodebuild | host | 14.70 s | 83.0% | 221.6 MB | 223.0 MB | 1 |
| node entry.js | host | 1.18 s | 6.7% | 85.2 MB | 94.4 MB | 1 |
| node e2e (exit charge) | host | 0.76 s | 4.3% | 0 B | 0 B | 0 |
| snapshot-bridge | host | 0.62 s | 3.5% | 116.4 MB | 116.6 MB | 1 |
| node e2e | host | 0.43 s | 2.4% | 104.8 MB | 134.0 MB | 1 |
| other (exit charge) | host | 0.03 s | 0.2% | 0 B | 0 B | 0 |
| simctl | host | 0.00 s | 0.0% | 20.5 MB | 20.5 MB | 1 |
| DTServiceHub | host | 0.00 s | 0.0% | 16.8 MB | 16.8 MB | 1 |
| (ps) | host | 0.00 s | 0.0% | 5.0 KB | 1.3 MB | 1 |
| (clang) | host | 0.00 s | 0.0% | 0 B | 0 B | 0 |
| (pgrep) | host | 0.00 s | 0.0% | 0 B | 0 B | 0 |
| (plutil) | host | 0.00 s | 0.0% | 0 B | 0 B | 0 |
| other | host | 0.00 s | 0.0% | 0 B | 0 B | 0 |
| wardenexample | sim | 50.77 s | 41.4% | 381.6 MB | 441.3 MB | 9 |
| iOS | sim | 50.70 s | 41.4% | 10.1 GB | 10.1 GB | 112 |
| AgentDeviceRunnerUITests-Runner | sim | 16.40 s | 13.4% | 271.0 MB | 271.1 MB | 1 |
| bun cli.ts | sim | 2.46 s | 2.0% | 264.5 MB | 270.9 MB | 1 |
| CoreSimulatorBridge | sim | 0.62 s | 0.5% | 81.5 MB | 81.6 MB | 1 |
| simctl | sim | 0.61 s | 0.5% | 563.5 KB | 20.7 MB | 9 |
| launchd_sim | sim | 0.42 s | 0.3% | 37.7 MB | 37.7 MB | 1 |
| (launchctl) | sim | 0.14 s | 0.1% | 62.1 KB | 15.9 MB | 1 |
| ps | sim | 0.14 s | 0.1% | 1.8 MB | 1.8 MB | 262 |
| (managedappdistri) | sim | 0.13 s | 0.1% | 68.6 KB | 17.6 MB | 1 |
| xpcproxy_sim | sim | 0.11 s | 0.1% | 119.0 KB | 13.4 MB | 4 |
| launchctl | sim | 0.07 s | 0.1% | 10.4 KB | 2.7 MB | 1 |
| other | sim | 0.00 s | 0.0% | 87.2 MB | 87.2 MB | 3 |
One table per framework, from the warm-median rep's timed run (the rep whose host CPU-seconds is the lower median). Rows are processes grouped by label (top 12 per scope, the rest in other); host is the framework's own process tree, sim the simulator's launchd_sim tree (iOS only). Share is of the scope's CPU-seconds. RSS is the label's summed RSS per 500 ms tick (0 where it had no process). Spawns counts distinct pids a tick saw: a process that lives between two ticks is only seen through the (exit charge) rows (CPU of a child the bench ran, booked at its exit), so many short-lived xcrun simctl calls read low in Spawns and in CPU.
Residue
- warden: none
- argent: paths: /Users/expo/.argent (328.0 KB)
- agent-device: driver apps: com.callstack.agentdevice.runner.uitests.xctrunner; paths: /Users/expo/.agent-device-bench/agent-device (2.9 MB)
- tester-army: driver apps: com.callstack.agentdevice.runner.uitests.xctrunner; paths: /Users/expo/.agent-device-bench/tester-army (4.9 MB)
Unsupported / failed
None.
Change since the previous run
The previous four-framework run on the same workflow and worker class, 01a172f5 at warden 0.1.1, is replaced by this one. Between them warden's resident helper took over launch, terminate and open-URL from simctl, reads fewer trees after an input, links idb 1.7.7 with its single-pass frame decoder, and boots simulators slim. The other frameworks are at the same versions on both runs.
| warden, warm | 0.1.1 (01a172f5) | 0.3.1 (01a1756a) | Delta |
|---|---|---|---|
| Suite median | 97.04 s | 86.30 s | -10.74 s (-11 %) |
| Step median | 170 ms | 85 ms | -85 ms (-50 %) |
| Host CPU-seconds per rep | 9.12 s | 2.97 s | -6.15 s (-67 %) |
of which warden-simd | 7.03 s | 1.76 s | -5.27 s (-75 %) |
| Host RSS peak | 184.9 MB | 158.6 MB | -26.3 MB |
| Ratio to Argent | 1.36× | 1.56× | |
| Ratio to agent-device | 0.95× | 1.06× | |
| Ratio to tester.army | 1.36× | 1.54× | |
| Pass rate / flakes | 100 % / 0 | 100 % / 0 |
Argent, agent-device and tester.army moved by less than 2 % between the two runs (131.81 → 134.32 s, 91.77 → 91.61 s, 132.34 → 132.52 s), which is the worker-to-worker noise to read every ratio against.
Artifacts
Each worker uploaded its results directory as one archive. The viewable files are copied here; the archives hold everything, including the per-rep resources.ndjson ticks and the 60 s idle control. To re-render one: download the archive, tar -xzf it, then bun run bench report Users/expo/bench-results from the warden repo.
Merged run
The four results merged into one run, bench-2026-10-25-ios-eas, ratios recomputed across the four: report.html, report.md, bench-results.json, summary.json (the comparison page's dataset).
warden
Worker job bench_warden, bun 1.3.14 + warden-e2e (this commit). Download the whole artifact (the EAS eas-ios-warden archive, unpacks to Users/expo/bench-results).
- report.html (self-contained, with charts) and report.md
- bench-results.json (schema v1, every rep, every test, every step, the 500 ms resource ticks per rep are in the archive) and summary.json
- bench-run.log (the harness), simd-build.log, host-facts.txt
- Framework logs: bench.log, warden.prepare.log, warden.rep-1.log, warden.rep-2.log, warden.rep-3.log, warden.rep-4.log, warden.rep-5.log, warden.teardown.log
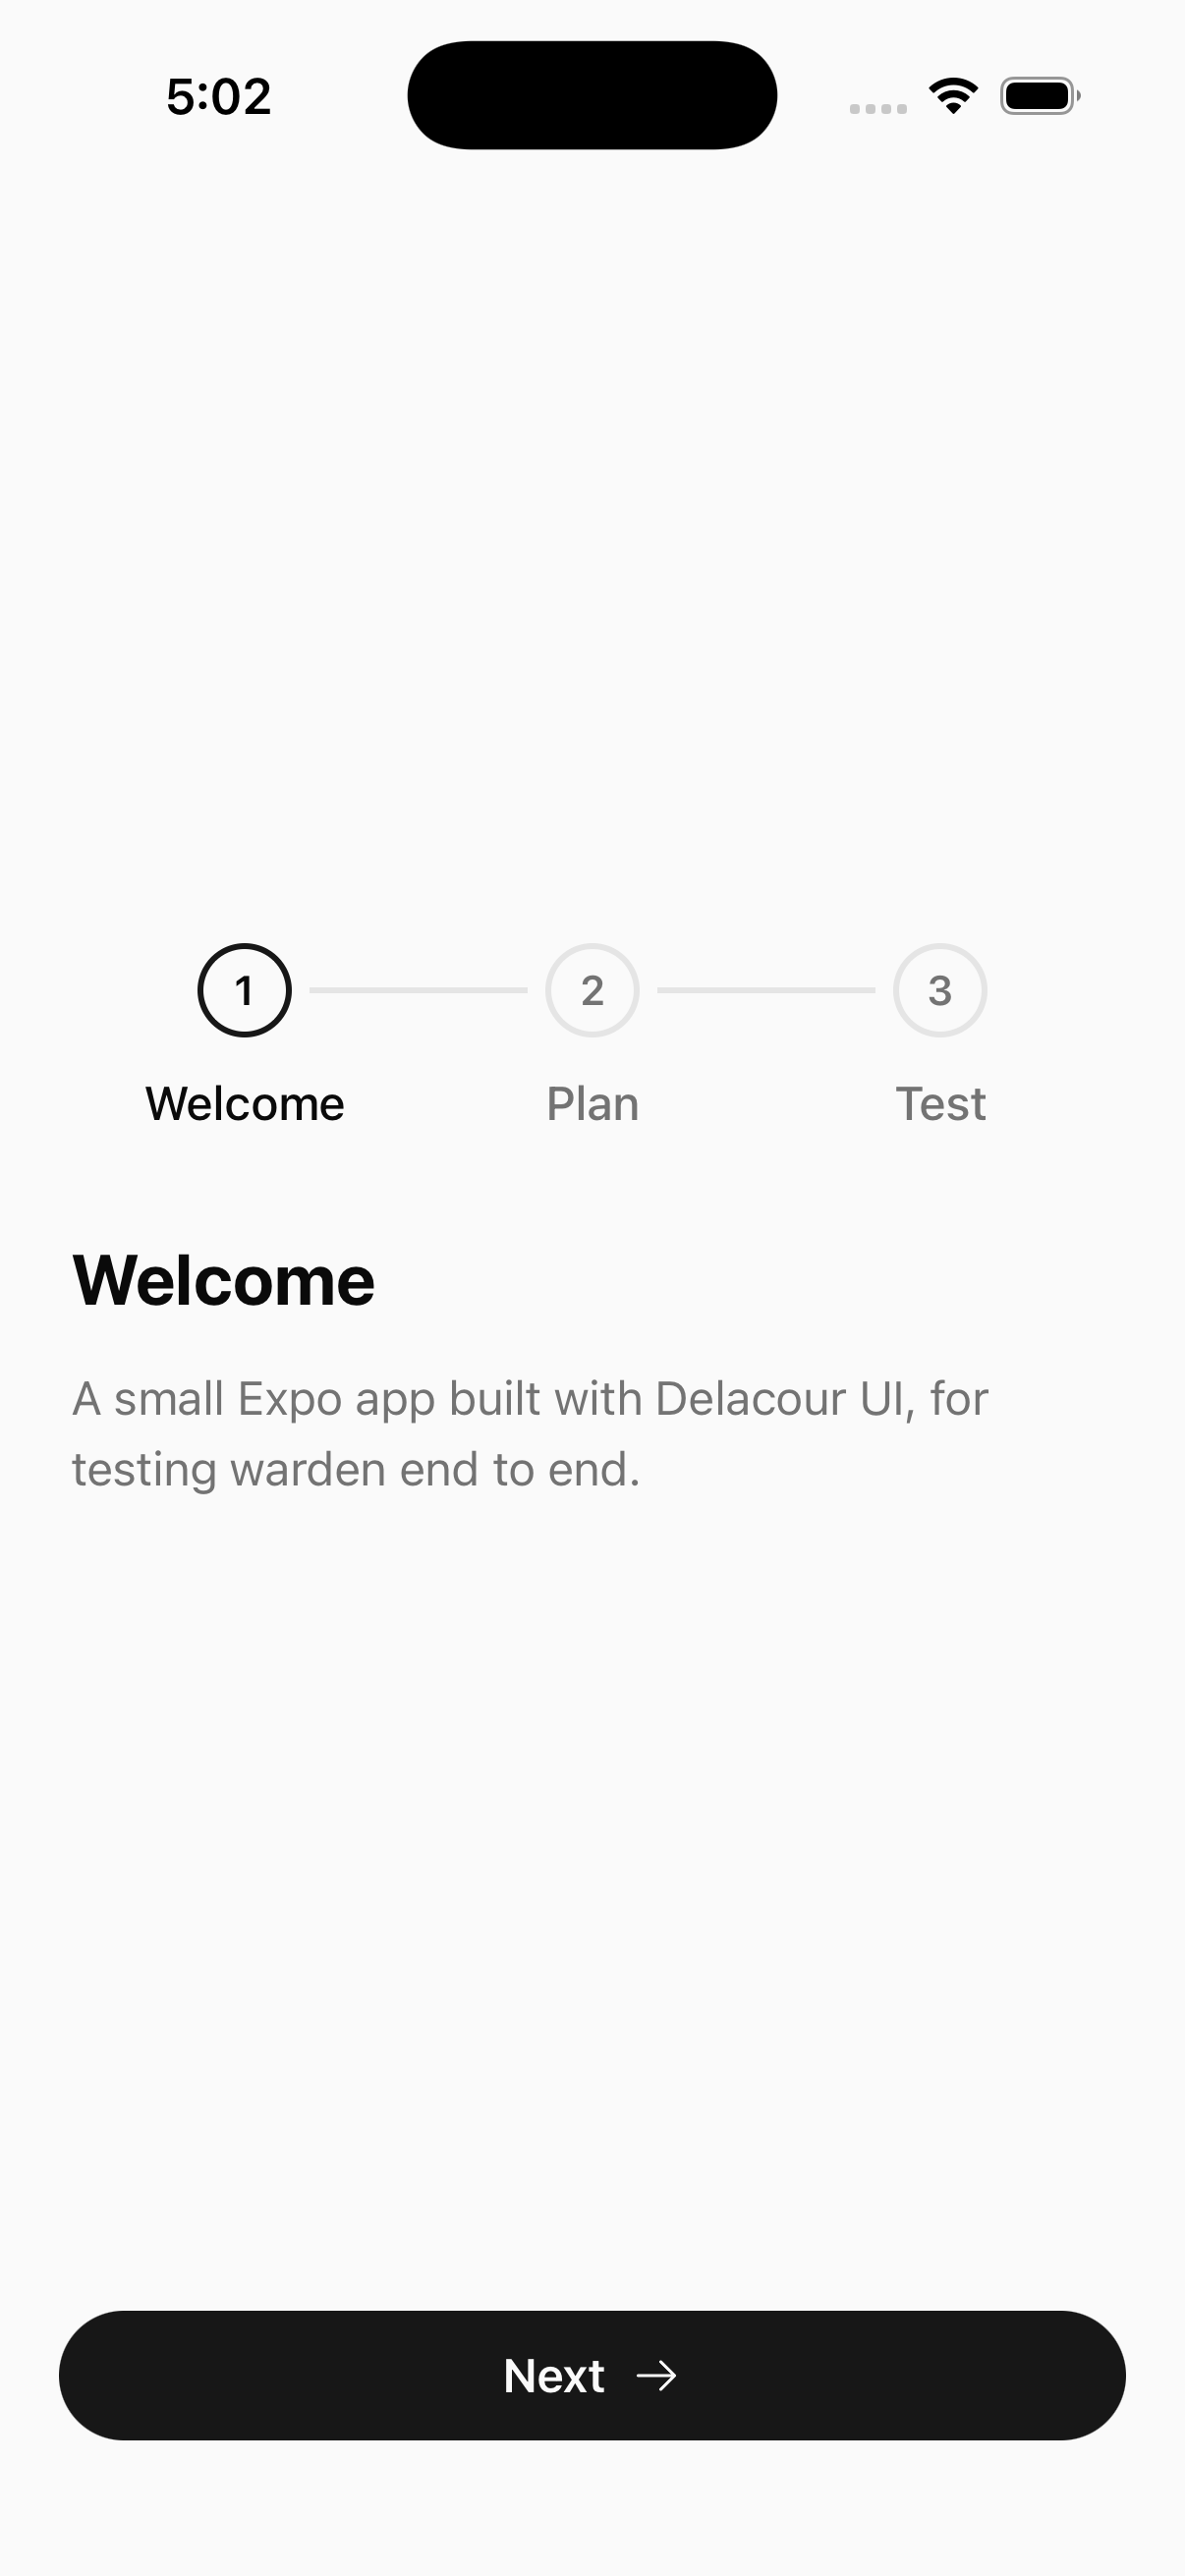
- The simulator as the job left it, after teardown:
Argent
Worker job bench_argent, @swmansion/argent 0.30.1. Download the whole artifact (the EAS eas-ios-argent archive, unpacks to Users/expo/bench-results).
- report.html (self-contained, with charts) and report.md
- bench-results.json (schema v1, every rep, every test, every step, the 500 ms resource ticks per rep are in the archive) and summary.json
- bench-run.log (the harness), fw-install.log, simd-build.log, host-facts.txt
- Framework logs: bench.log
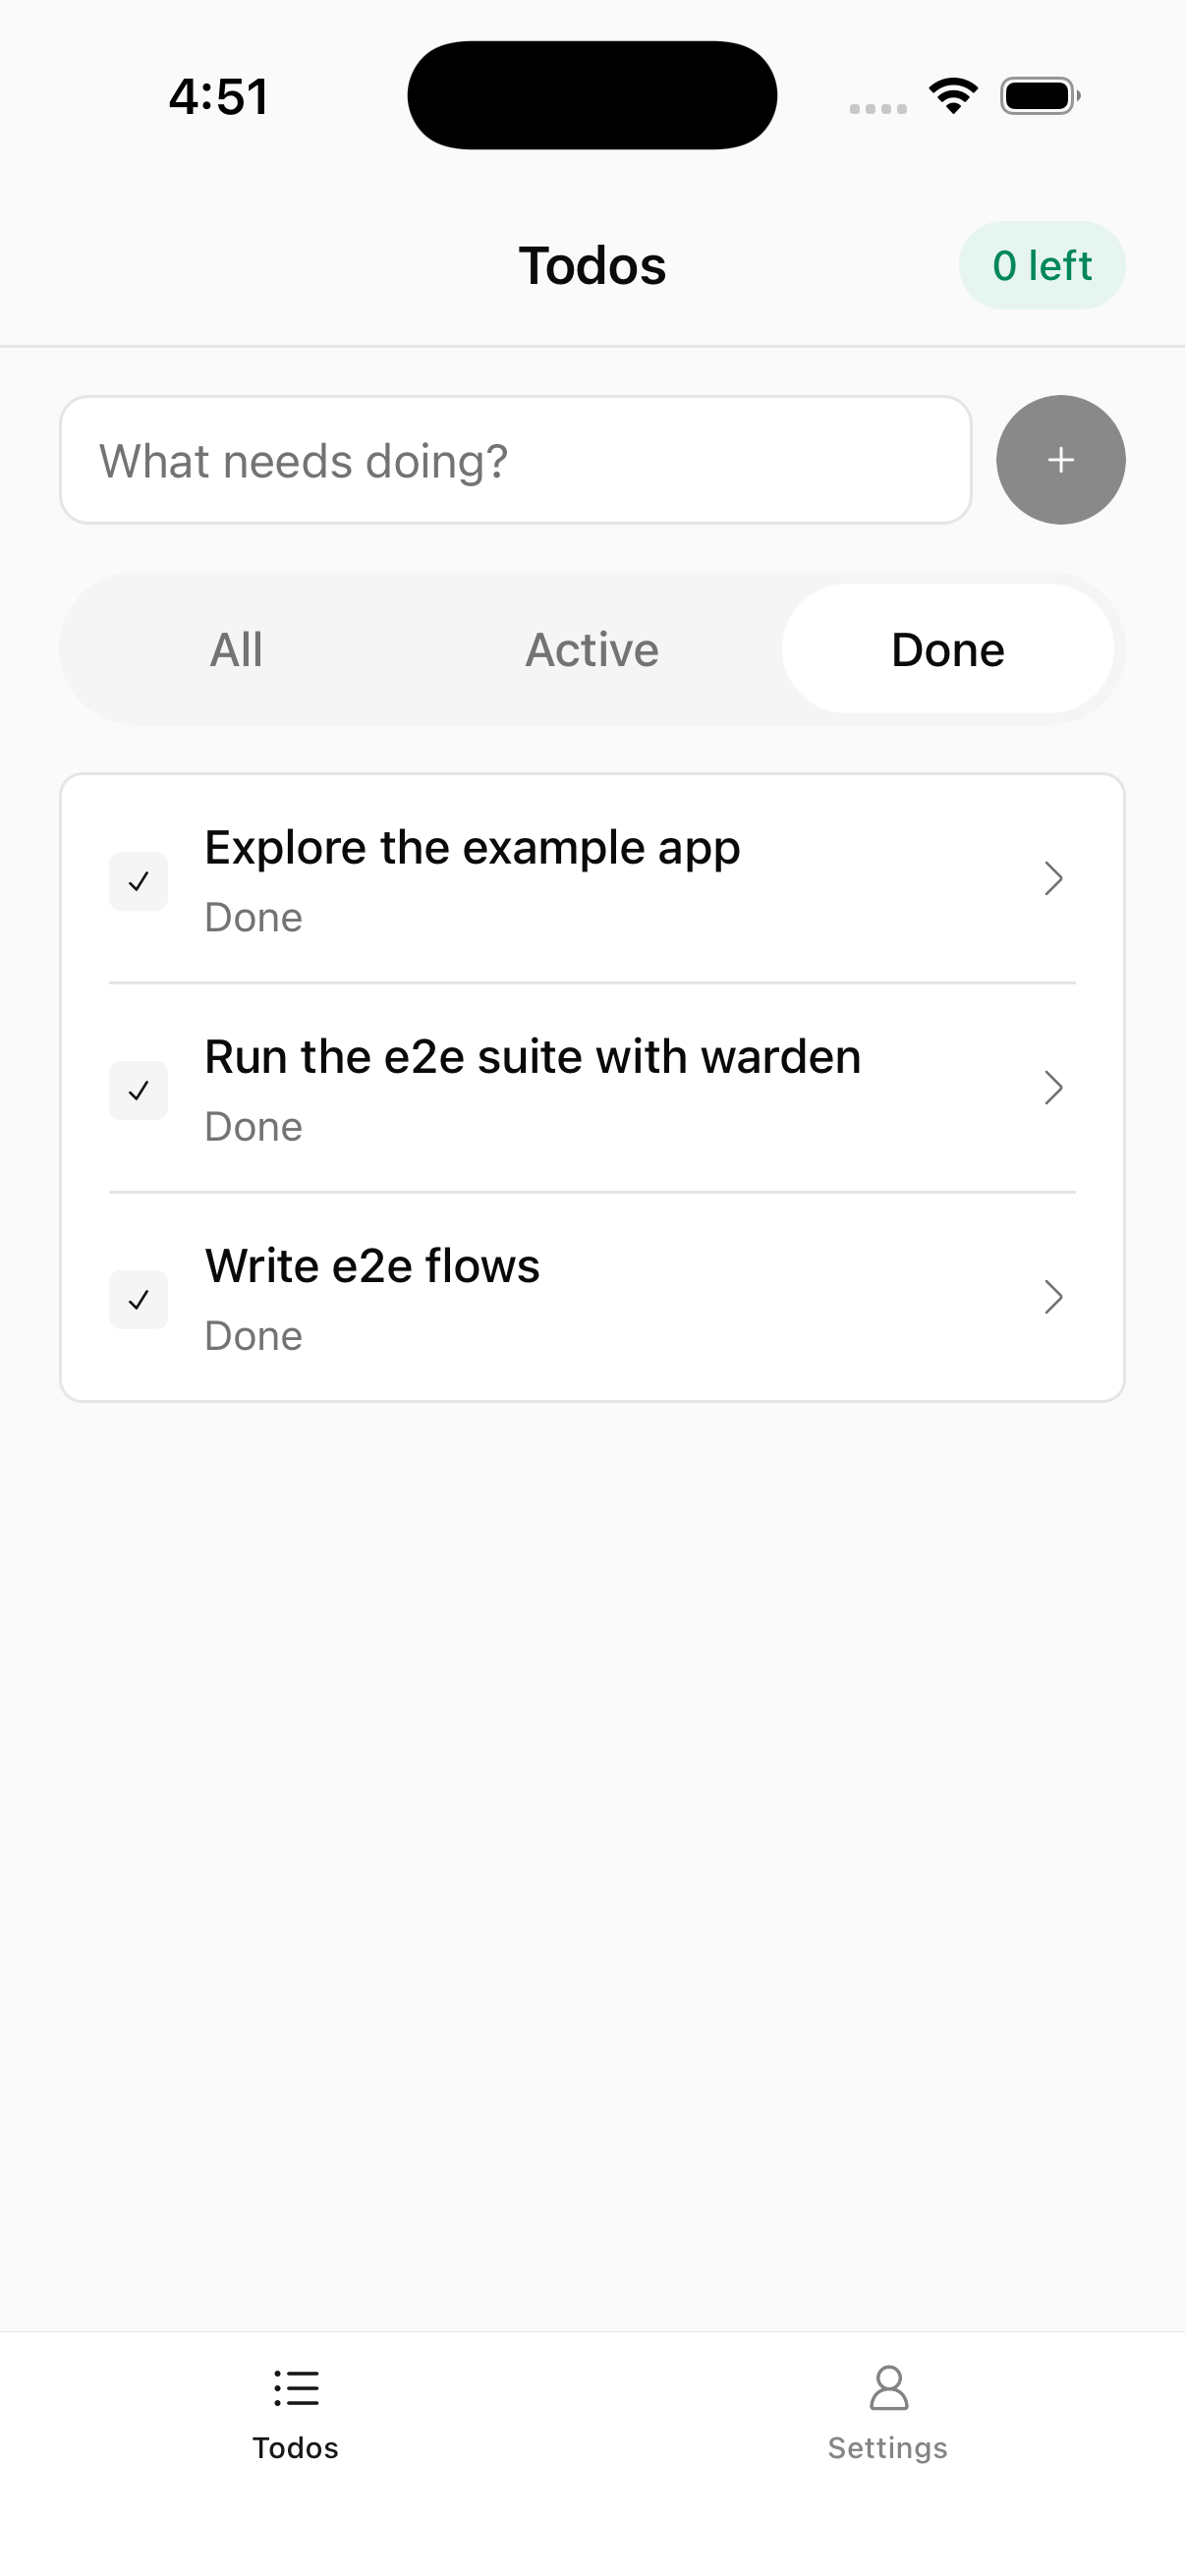
- The simulator as the job left it, after teardown:
agent-device
Worker job bench_agent_device, agent-device 0.21.31. Download the whole artifact (the EAS eas-ios-agent-device archive, unpacks to Users/expo/bench-results).
- report.html (self-contained, with charts) and report.md
- bench-results.json (schema v1, every rep, every test, every step, the 500 ms resource ticks per rep are in the archive) and summary.json
- bench-run.log (the harness), fw-install.log, simd-build.log, host-facts.txt
- Framework logs: agent-device.prepare.log, bench.log
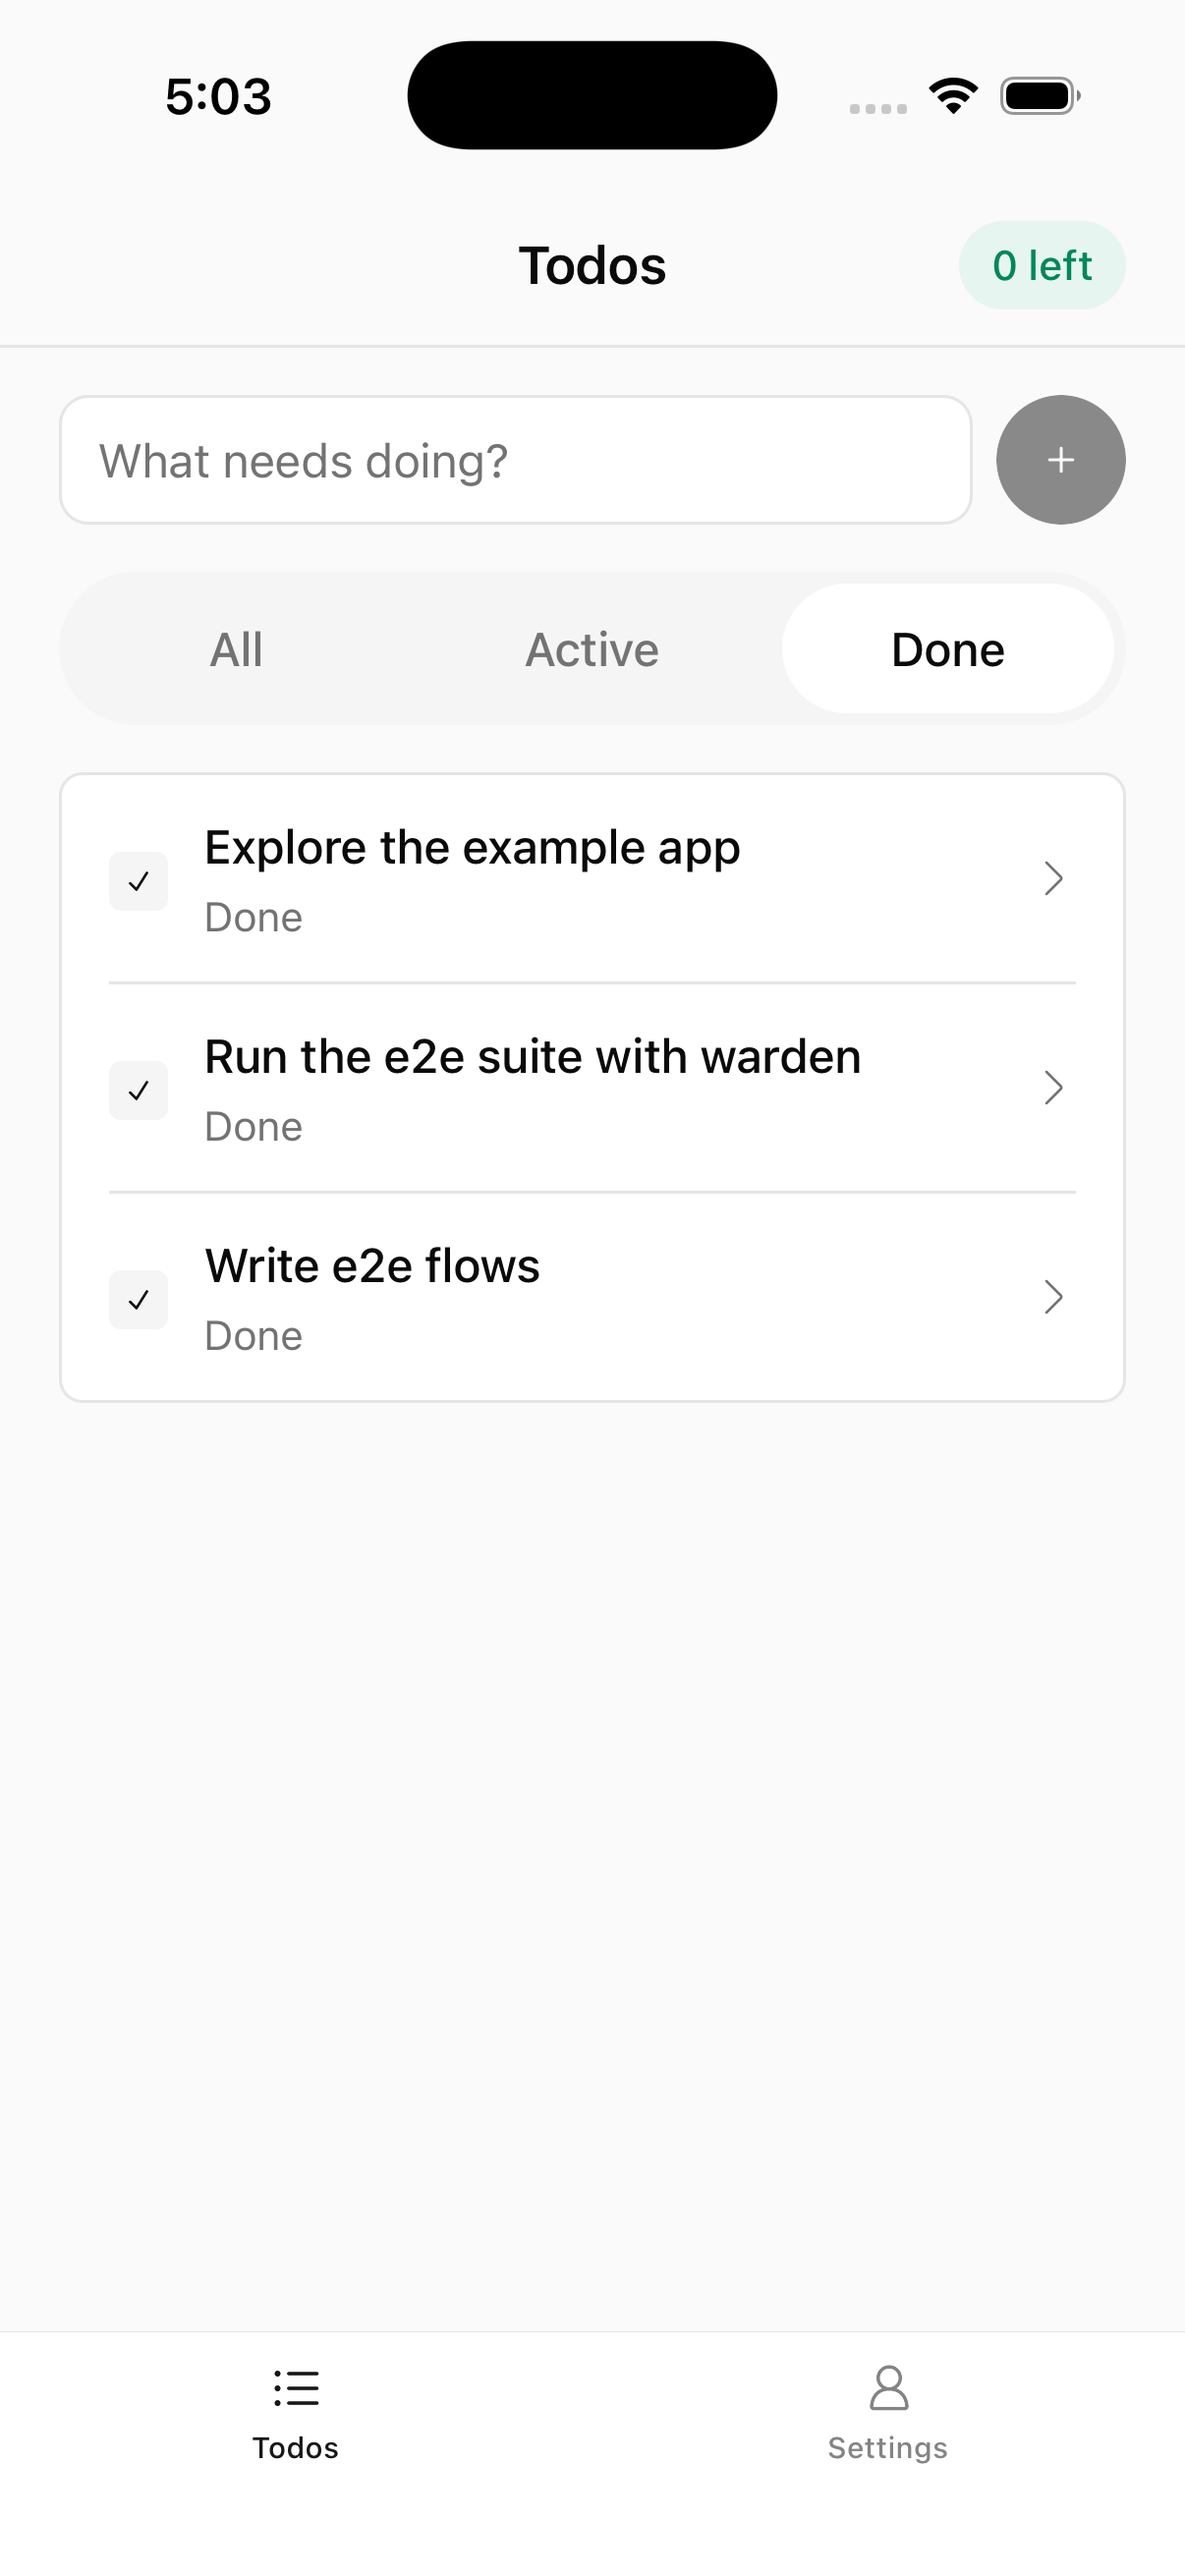
- The simulator as the job left it, after teardown:
tester.army
Worker job bench_tester_army, e2e 0.20.0, bundling agent-device 0.21.25. Download the whole artifact (the EAS eas-ios-tester-army archive, unpacks to Users/expo/bench-results).
- report.html (self-contained, with charts) and report.md
- bench-results.json (schema v1, every rep, every test, every step, the 500 ms resource ticks per rep are in the archive) and summary.json
- bench-run.log (the harness), simd-build.log, host-facts.txt
- Framework logs: bench.log, tester-army.rep-1.log, tester-army.rep-2.log, tester-army.rep-3.log, tester-army.rep-4.log, tester-army.rep-5.log, tester-army.teardown.log
- The simulator as the job left it, after teardown: